When reviewing national real estate reports, data suggests that the broader housing market has entered a period of decelerated activity. Driven by mortgage rates fluctuating between 7.3% and 7.5%, elevated rate environments, rising price reductions across several major metropolitan areas, and growing national inventory, real estate performance across the United States reflects a clear cooling trend.
However, an analysis of hyper-local data in Morris County, New Jersey, presents a distinctly different narrative.
While transaction velocity has tempered nationwide, Northern New Jersey continues to demonstrate strong market fundamentals, sustained price appreciation, and competitive buyer conditions. Below is an overview of how broader national dynamics intersect with local market trends across Morris County communities.
Municipal Market Comparison
Town | Single-Family Median Price | Single-Family Avg Price | Avg % of Asking Price | YTD Sales Volume Change | YTD Under-Contract Change | Days on Market (DOM) Change |
Chester Township | $1,157,500 | $1,141,070 | 104.1% | +29.4% | +33.8% | -36.6% |
Denville | $750,000 | $824,944 | 104.6% | -6.9% | -4.2% | -4.0% |
Mendham Township | $1,367,000 | $1,524,020 | 103.8% | -6.7% | -4.8% | -10.3% |
Morris Plains | $842,500 | $823,606 | 107.9% | -20.0% | -20.5% | -27.3% |
Morristown | $810,000 | $880,332 | 104.2% | -26.4% | -19.2% | -19.2% |
Randolph | $885,625 | $940,355 | 105.4% | -4.6% | +4.3% | -4.0% |
Roxbury | $665,000 | $674,615 | 105.1% | +22.7% | +27.9% | -11.5% |
Whippany | $830,000 | $910,684 | 105.3% | -3.0% | -15.0% | -16.7% |
The Macro Picture: National Trends vs. North Jersey Performance
At the national level, borrowing costs have caused buyer demand to moderate. Pending home sales across the United States are down approximately 12% compared to last year, active inventory has increased by over 5%, and more than 43% of active listings nationally have implemented price reductions.
In contrast, Morris County real estate remains insulated from these broader national shifts due to several core demand drivers:
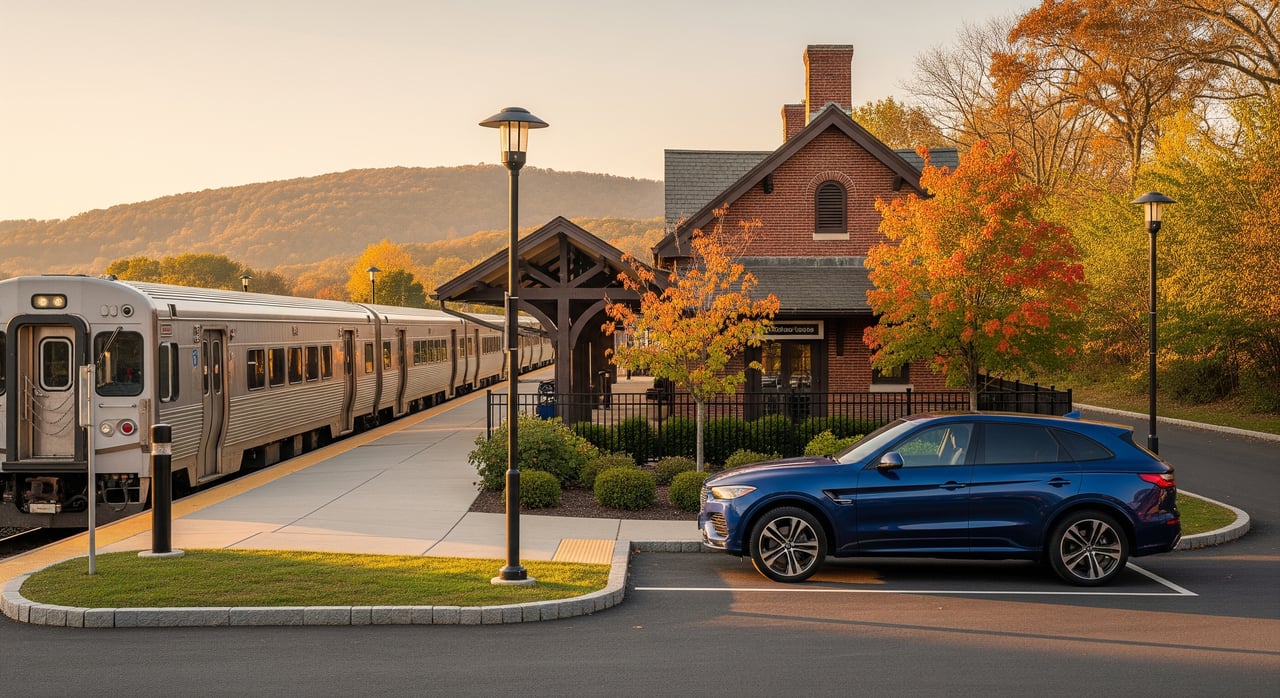
- Continued Commuter Inflow: Sustained demand from buyers relocating from New York City and Hudson County who seek single-family properties with private lot space and direct rail access to Manhattan.
- School District Performance: Highly regarded public school systems continue to support baseline buyer demand across economic cycles.
- Severe Supply Constraints: Existing homeowners retaining historically low, pandemic-era mortgage rates remain hesitant to list, maintaining a structural supply deficit. Although active single-family listings across Morris County rose 17.1% year-to-date to 971 available properties, inventory remains tight relative to qualified buyer demand
As a result, Morris County single-family properties have achieved an average of 105.3% of asking price year-to-date, with homes spending an average of just 27 days on market.
Morris County Market Overview (Q3 & YTD 2026)
County-wide statistics indicate consistent price growth alongside stable transaction metrics across property categories:
- Single-Family Properties: The year-to-date median sales price increased 6.2% to $785,000
- Condominiums, Co-ops, and Townhouses: Serving as a primary entry point for buyers, the condominium and townhouse median sales price rose 4.9% year-to-date to $535,000
Municipal Market Performance Highlights
Real estate dynamics vary significantly by municipality across Morris County through the third quarter:
Outer Submarket Expansion
- Chester Township: Transaction volume and values increased substantially. Year-to-date single-family closed sales rose 29.4%, while signed contracts grew 33.8%
- Roxbury: Serving as an accessible suburban market point ($665,000 single-family median)
Luxury Submarkets
- Chatham Borough & Chatham Township: High-end demand remains strong. Single-family homes in Chatham Borough commanded an average of 112.6% of asking price year-to-date, with a median price of $1,550,618
- Mendham Township & Mendham Borough: Mendham Township maintained a higher-tier average single-family price of $1,524,020
Suburban Commuter Hubs
- Morristown: Inventory constraints led to a decline in closed single-family transaction volume year-to-date
- Morris Plains: Properties continue to move rapidly, with single-family listings commanding an average of 107.9% of asking price year-to-date and going under contract in an average of 16 days
- Randolph: Randolph demonstrated steady pricing growth, with the average single-family sales price rising 6.5% year-to-date to $940,355
- Denville & Whippany: Both municipalities recorded strong offer metrics, with properties averaging 104.6% of asking price in Denville
Strategic Guidance for Buyers
National news reports highlighting widespread price reductions or inventory build-ups do not reflect the hyper-local realities of North Jersey. Well-maintained properties in sought-after school districts continue to attract multiple offers over list price. Success in this environment requires strong financing pre-approvals, clear offer terms, and efficient execution. However, during late fall and winter, select opportunities may arise with sellers seeking to finalize transactions prior to the spring cycle.
Strategic Guidance for Sellers
Market leverage remains weighted toward home sellers due to low overall supply and persistent buyer interest. Properties positioned accurately relative to recent comparable sales continue to generate competitive interest. Given buyer sensitivity to elevated mortgage rates, competitive initial pricing remains the most effective strategy for maximizing final sale values.